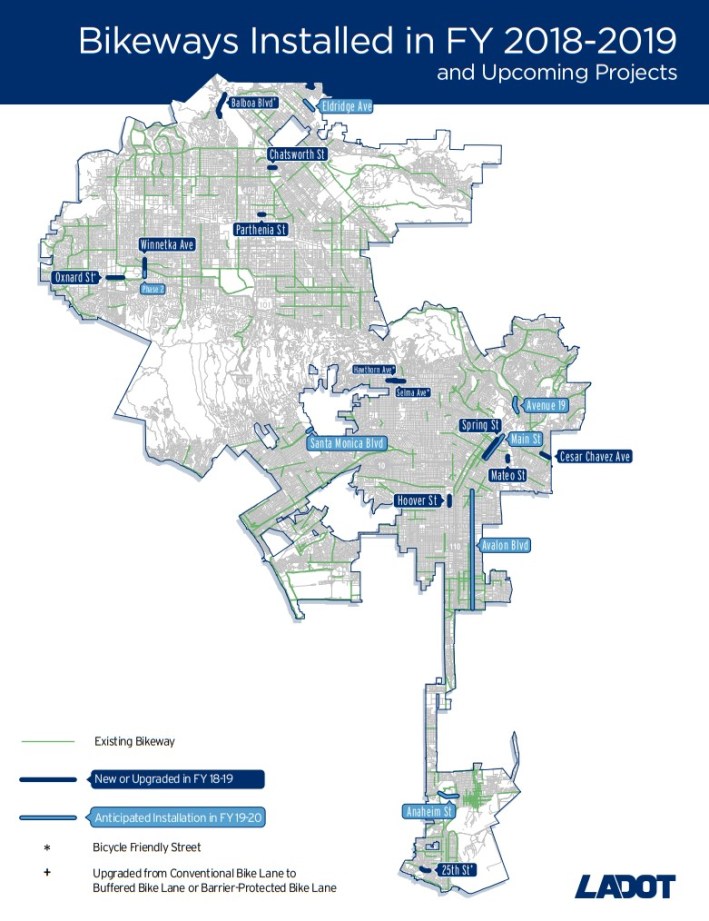
In a blog post last week, the L.A. City Department of Transportation "celebrated" that it had "installed or upgraded 13 lane-miles of Los Angeles’ on-street bike network." The post included the following map of new/upgraded bike facilities, as well as "upcoming" bikeways.
LADOT provided Streetsblog a listing of bikeway implementation for the past two fiscal years.
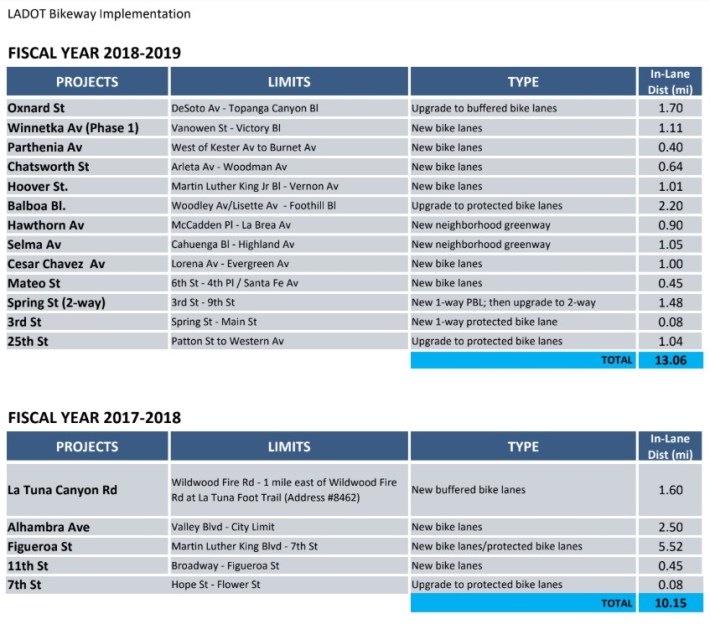
LADOT's post draws attention to several worthwhile new bikeways - including downtown L.A.'s Spring Street two-way protected bike lanes, new Winnetka lanes, and others.
Overall, though, the 13 lane-miles represent very little new mileage. LADOT's FY18-19 bikeway implementation includes:
- 4.7 miles of new on-street bike lanes
- 6.4 miles of upgrades of existing bike lanes
- 1.9 miles of adding bulb-outs and crosswalks to streets with existing sharrows
It didn't take long for L.A. bike Twitter to weigh in critically. Bike The Vote L.A.'s Michael MacDonald compared L.A.'s bikeway network to "scattered breadcrumbs" and declared that the city "is failing on active transportation." In an email to SBLA, MacDonald elaborated that
L.A. is in the midst of two health crises that are directly tied to active transportation: its worst air quality since the 1990s and a large increase in the number of Angelenos killed in car crashes. L.A. could make meaningful strides on both issues by simply building out its planned bike network. Every year that L.A. fails to act means hundreds of preventable deaths and a failure to prevent climate change. Angelenos deserve urgency and determination from our mayor and city council to deliver the safe and sustainable streets that we have already done the work of planning for.
MacDonald added the latest mileage to his graph of LADOT bikeway implementation. Fiscal years 2017-18 and 2018-19 have seen the least bikeway implementation in the past decade.
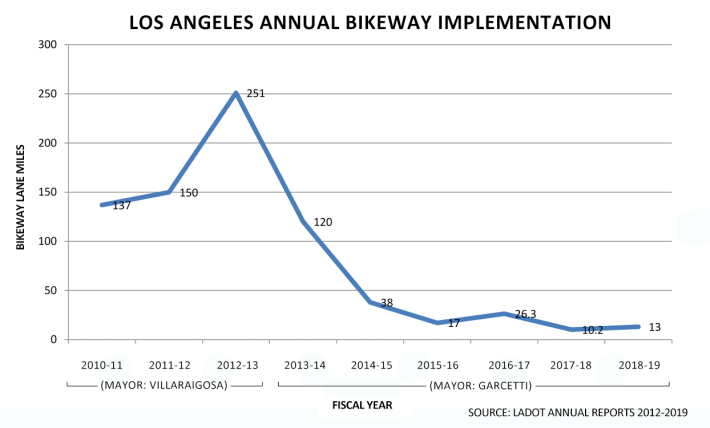
(Note that the graph uses LADOT figures that include both new and upgraded mileage. In a few cases this double-counts mileage. The Los Angeles Street bike lanes were counted when they were first installed in June, 2012, then counted again when they were upgraded to protected bike lanes in June, 2016. Similarly Spring Street was counted in 2011 and again in 2019. Facility upgrades are good, and needed, but do not actually extend the network. Theoretically, LADOT could count street sections about a half-dozen times by initially adding signs, then sharrrows, then lanes, then buffers, then bollards.)
Prior to the 2011 adoption of the city's "2010" bike plan, LADOT implemented roughly four to six lane-miles of new bike lanes annually. In 2011, Mayor Antonio Villaraigosa directed LADOT to add 40 new bikeway center-line miles each year. In 2015, LADOT shifted from reporting "center-line" to "lane-mile" miles, so the 40 new miles mandate is 80 miles under LADOT's current lane-mileage reporting.
From fiscal years 2011 through 2014, LADOT added more than 80 miles of new bike lanes each year.
New bikeway mileage declined precipitously under Mayor Eric Garcetti, and further under LADOT General Manager Seleta Reynolds.
In responding to declining mileage reports in 2015 and 2016, Seleta Reynolds emphasized quality over quantity asserting that LADOT is "raising the bar to build the safest, most organized infrastructure." To some extent this is true. In 2015, under Reynolds, LADOT first began implementing protected bike lanes. There are now more than a half-dozen protected bikeways, including great Spring Street upgrades this year, but protected bikeways remain few and far between.
The blame does not lie entirely on Reynolds' department. L.A.'s fifteen city councilmembers have de facto veto power over bikeway facilities on streets in their districts. Several councilmembers, including Gil Cedillo, Curren Price, David Ryu, and Paul Koretz, have blocked planned bikeways in their respective districts. Other more centrist councilmembers, including Mitch O'Farrell and Paul Krekorian, blocked planned bikeways after a Playa Del Rey nativist backlash undid bike lanes and other road diet safety improvements there.
What about the future? LADOT's new map shows just over 21 lane-miles of "upcoming" bikeways, with installation "anticipated in FY19-20." These include portions of Anaheim Street, Avalon Boulevard, Avenue 19, Eldridge Avenue, downtown L.A.'s Main Street, Santa Monica Boulevard, and Winnetka Avenue.

Unfortunately, LADOT has a history of touted upcoming facilities that failed to materialize. The 2016 LADOT annual report proclaimed that the department had "designed" 12.43 lane-miles of protected bike lanes, including ones on Highland Avenue that have yet to be installed in 2019. The Anaheim Street mileage has been on LADOT's to-do lists for over a decade.
The L.A. County Bicycle Coalition board vice president Kevin Shin criticizes LADOT for celebrating just 13 new/improved lane-miles while other big cities, including Chicago and New York City, set and meet higher bars. Shin points out that L.A. is geographically larger (502 square miles) compared to those places (234 and 302 square miles, respectively.) Shin states that the LACBC wants to work more closely with LADOT and communities, to help overcome hurdles to getting projects done.
L.A. has some vague objectives ("build bike infrastructure") in Mayor Garcetti's sustainability pLAn. Under Garcetti's Vision Zero directive, the city's goal is to end all traffic deaths by 2025.
Under Garcetti, the city has no current bikeway implementation mileage goals.
Without stated mileage goals, it is easy for LADOT to "celebrate" dismally low totals - 10 and 13 lane-miles for the past two fiscal years - as if they represent anything other than a failure.
